Kategori : NATURAL GAS ENERGY NEWS, ELECTRICITY ENERGY NEWS, ENERGY AGENDA NEWS, SOLAR ENERGY NEWS, HYDROELECTRIC POWER PLANT NEWS, COAL NEWS, WIND ENERGY & RES NEWS - Tarih : 05 July 2020
Saudi Arabia? Russia? The United States—which is the world’s biggest producer of oil, natural gas, and nuclear power?
Nope. It’s China…by a long way.

Why? Well, China is the world’s biggest producer of hydroelectricity and other renewables. Indeed, China is the world’s biggest producer of BOTH wind and solar energy—bet you didn’t know that!
But the real reason is coal. China is by far the world’s biggest coal producer, accounting for nearly half of global production. (In contrast, the US as the biggest oil & natural gas supplier accounts for “only” 17% and 23%, respectively, of the global totals…) The energy content of China’s coal production is bigger than US oil, natural gas, and coal production combined. No other form of energy is dominated by one country like coal is by China. Within China, coal accounts for 58% of total energy use; for all other countries, coal’s share of total energy use is just 17%.
This has massive implications for CO2 emissions, which fell significantly last year in the US and other mature economies, but increased in China and other emerging economies.
So China’s the #1 energy producer. But who is changing fastest—how about looking at energy supply growth in 2019?
Surely the continued massive growth of US oil and natural gas thanks to the shale revolution has to make the US the biggest source of energy supply growth? (Note that this data was recorded before the onset of the COVID-19 pandemic, which has driven US oil & gas production sharply lower this year…)
Wrong again. The world’s biggest growth in energy supply last year came from…China.
Overall US energy production did grow rapidly last year – by almost 6% – but oil & natural gas production increases were partly offset by a large decline in domestic coal production, which continues to lose market share in power generation to gas & renewables. Indeed, the US had the world’s biggest decline in coal production last year.
While the US had the largest growth in oil & gas production, China had the largest growth in everything else: nuclear, hydro, other renewables…and in coal (though interestingly, the increase in coal barely accounted for half of China’s total energy production growth last year).
By the way, China is the world’s biggest producer AND consumer of energy. On the supply side, it passed the US in 2005; it became the biggest consumer in 2009. China produces 20% of global energy, while consuming 24% (with 18% of the world’s population and about 16% of global GDP at market exchange rates). The US consumes and produces 16% of the world total, with 4% of the population and 24% of global GDP. With its heavy dependence on coal, China also accounts for nearly 30% of global energy-related CO2 emissions, compared with 15% for the US.
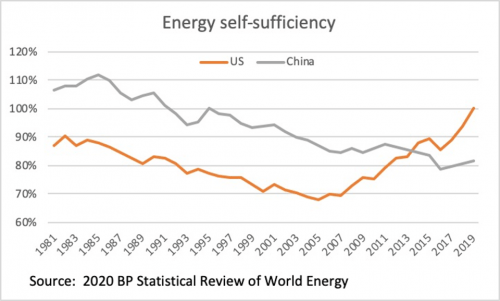
Even though the US didn’t have the world’s largest energy production increase in 2019, last year’s growth DID achieve something extraordinary: The US Energy Department reports that in net terms, the US achieved overall energy self-sufficiency for the first time since 1952. China, on the other hand, was self-sufficient until the mid-1990s, and over the past 25 years has become the world’s largest energy importer (net in energy terms), relying on imports to meet nearly 20% of total consumption. China imports more energy than Japan consumes. But note: China has managed to slightly improve its energy self-sufficiency in recent years, with domestic forms of energy growing more rapidly than imports.

Bottom line: While the shale revolution in the US has been a game-changer for the US domestic energy situation, and for global oil & natural gas markets, the global energy system – both supply AND demand – is more about China. And ditto for energy-related CO2 emissions.
Objective data is crucial to good decision-making. When it comes to China, you can follow the research and data collected at the Baker Institute that looks deeply into the country’s energy demand, supply, and infrastructure. For the global picture, have a look at the BP data for yourself.
You may find some energy trivia that can earn you a free drink now that bars are starting to open up again!
This post originally appeared on the Forbes blog on June 19, 2020.


