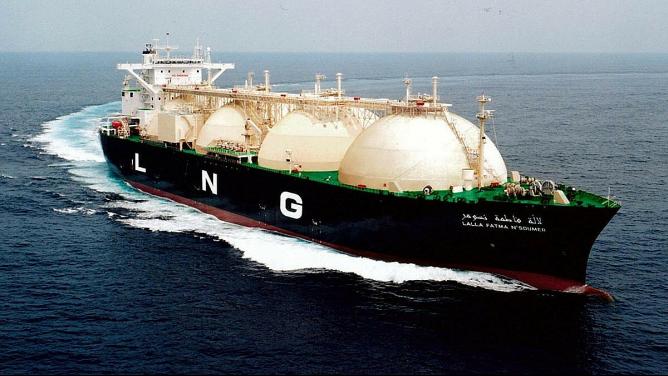
The Covid-19 pandemic has brought new challenges for the global gas industry, with the LNG shipping market not being an exception. Because of the Covid-19 pandemic, the market witnessed a reduction in the global gas demand in 2020, which resulted in a slowdown of the global LNG trade and lower-than-expected demand for LNG carriers.
These developments, coupled with the commissioning of a large number of new carriers, led to the oversupply of LNG carriers in the shipping market. However, a recovery of LNG demand in early 2021 has raised a question: where is the LNG shipping market drifting, and whether in the short- and medium-term there will be enough LNG carriers on the market to transport liquefied natural gas.

In the short- and medium-term, the global LNG shipping market is anticipated to be balanced due to the upcoming commissioning of new LNG carriers. At least 142 LNG carriers, ordered recently, are expected to come on line between 2021 and 2025. Out of the total number, 46 LNG carriers are to be commissioned in 2021 followed by 38 carriers in 2022. South Korean shipbuilders account for the majority of LNG carriers on the order book. Hyundai, Samsung and Daewoo are going to build 110 carriers, while the Russian firm Zvezda has orders for 15 carriers and China’s Hudong for 11 carriers.
The ratio of global LNG exports to the number of LNG carriers gives an indication of the average volume of LNG transported by one LNG carrier throughout a specific year. A higher ratio indicates a tighter LNG shipping market. Over the last decade, the LNG shipping market has loosened, supported by the increasing availability of LNG carriers. From 2011 to 2020, the ratio fell from 0.73 to 0.59, which implies that in 2020 one LNG carrier transported on average 0.59 million tonnes per annum (mtpa)
The global LNG carrier fleet is renewed on a regular basis, with old carriers being scrapped and new ones continuously being added. The construction of LNG carriers has always been associated with the commissioning of new LNG liquefaction capacity. The building of LNG carriers in the mid-2000s was largely driven by the completion of LNG plants in Qatar, while in the late 2010s it was driven by the completion of LNG plants in Australia, U.S., and Russia. As a result, various groups of LNG carriers operate on the market depending on commissioning date. Currently, at least four (4) carriers in operation today were commissioned in the 1970s, 10 carriers in the 1980s, 54 carriers in the 1990s, 244 carriers in the 2000s, and 294 carriers commissioned in the 2010s.


